Our website is made possible by displaying online advertisements to our visitors.
Please consider supporting us by disabling your ad blocker.
Dendrogram
This article needs additional citations for verification. (January 2017) |


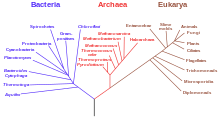
A dendrogram is a diagram representing a tree. This diagrammatic representation is frequently used in different contexts:
- in hierarchical clustering, it illustrates the arrangement of the clusters produced by the corresponding analyses.[4]
- in computational biology, it shows the clustering of genes or samples, sometimes in the margins of heatmaps.[5]
- in phylogenetics, it displays the evolutionary relationships among various biological taxa. In this case, the dendrogram is also called a phylogenetic tree.[6]
The name dendrogram derives from the two ancient greek words δένδρον (déndron), meaning "tree", and γράμμα (grámma), meaning "drawing, mathematical figure".[7][8]
- ^ Swofford DL, Olsen GJ, Waddell PJ, Hillis DM (1996). "Phylogenetic inference". In Hillis DM, Moritz C, Mable BK (eds.). Molecular Systematics, 2nd edition. Sunderland, MA: Sinauer. pp. 407–514. ISBN 9780878932825.
- ^ Van Soest R, Boury-Esnault N, Vacelet J, Dohrmann M, Erpenbeck D, De Voogd N, Santodomingo N, Vanhoorne B, Kelly M, Hooper J (2012). "Global Diversity of Sponges (Porifera)". PLOS ONE. 7 (4): e35105. Bibcode:2012PLoSO...735105V. doi:10.1371/journal.pone.0035105. PMC 3338747. PMID 22558119.
- ^ Woese, Carl R.; Kandler, O; Wheelis, M (1990). "Towards a natural system of organisms: proposal for the domains Archaea, Bacteria, and Eucarya" (PDF). Proc Natl Acad Sci USA. 87 (12): 4576–4579. Bibcode:1990PNAS...87.4576W. doi:10.1073/pnas.87.12.4576. PMC 54159. PMID 2112744.
- ^ Everitt, Brian (1998). Dictionary of Statistics. Cambridge, UK: Cambridge University Press. p. 96. ISBN 0-521-59346-8.
- ^ Wilkinson, Leland; Friendly, Michael (May 2009). "The History of the Cluster Heat Map". The American Statistician. 63 (2): 179–184. CiteSeerX 10.1.1.165.7924. doi:10.1198/tas.2009.0033. S2CID 122792460.
- ^ "Phylogenetic tree (biology)". Encyclopedia Britannica. Retrieved 2018-10-22.
- ^ Bailly, Anatole (1981-01-01). Abrégé du dictionnaire grec français. Paris: Hachette. ISBN 2010035283. OCLC 461974285.
- ^ Bailly, Anatole. "Greek-french dictionary online". www.tabularium.be. Retrieved October 20, 2018.
Previous Page Next Page


