Our website is made possible by displaying online advertisements to our visitors.
Please consider supporting us by disabling your ad blocker.

Portal:Mathematics
-
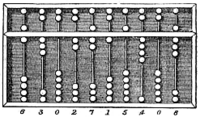 Abacus, a ancient hand-operated calculating.
 -
 Portrait of Emmy Noether, around 1900.
 -


Mathematics is a field of study that discovers and organizes methods, theories and theorems that are developed and proved for the needs of empirical sciences and mathematics itself. There are many areas of mathematics, which include number theory (the study of numbers), algebra (the study of formulas and related structures), geometry (the study of shapes and spaces that contain them), analysis (the study of continuous changes), and set theory (presently used as a foundation for all mathematics). (Full article...)
Featured articles
-

The first 15,000 partial sums of 0 + 1 − 2 + 3 − 4 + ... The graph is situated with positive integers to the right and negative integers to the left.
In mathematics, 1 − 2 + 3 − 4 + ··· is an infinite series whose terms are the successive positive integers, given alternating signs. Using sigma summation notation the sum of the first m terms of the series can be expressed as
The infinite series diverges, meaning that its sequence of partial sums, (1, −1, 2, −2, 3, ...), does not tend towards any finite limit. Nonetheless, in the mid-18th century, Leonhard Euler wrote what he admitted to be a paradoxical equation:
(Full article...) -
The number π (/paɪ/ ⓘ; spelled out as "pi") is a mathematical constant, approximately equal to 3.14159, that is the ratio of a circle's circumference to its diameter. It appears in many formulae across mathematics and physics, and some of these formulae are commonly used for defining π, to avoid relying on the definition of the length of a curve.
The number π is an irrational number, meaning that it cannot be expressed exactly as a ratio of two integers, although fractions such as are commonly used to approximate it. Consequently, its decimal representation never ends, nor enters a permanently repeating pattern. It is a transcendental number, meaning that it cannot be a solution of an algebraic equation involving only finite sums, products, powers, and integers. The transcendence of π implies that it is impossible to solve the ancient challenge of squaring the circle with a compass and straightedge. The decimal digits of π appear to be randomly distributed, but no proof of this conjecture has been found. (Full article...) -
The Quine–Putnam indispensability argument is an argument in the philosophy of mathematics for the existence of abstract mathematical objects such as numbers and sets, a position known as mathematical platonism. It was named after the philosophers Willard Van Orman Quine and Hilary Putnam, and is one of the most important arguments in the philosophy of mathematics.
Although elements of the indispensability argument may have originated with thinkers such as Gottlob Frege and Kurt Gödel, Quine's development of the argument was unique for introducing to it a number of his philosophical positions such as naturalism, confirmational holism, and the criterion of ontological commitment. Putnam gave Quine's argument its first detailed formulation in his 1971 book Philosophy of Logic. He later came to disagree with various aspects of Quine's thinking, however, and formulated his own indispensability argument based on the no miracles argument in the philosophy of science. A standard form of the argument in contemporary philosophy is credited to Mark Colyvan; whilst being influenced by both Quine and Putnam, it differs in important ways from their formulations. It is presented in the Stanford Encyclopedia of Philosophy: (Full article...) -

Plots of logarithm functions, with three commonly used bases. The special points logb b = 1 are indicated by dotted lines, and all curves intersect in logb 1 = 0.
In mathematics, the logarithm of a number is the exponent by which another fixed value, the base, must be raised to produce that number. For example, the logarithm of 1000 to base 10 is 3, because 1000 is 10 to the 3rd power: 1000 = 103 = 10 × 10 × 10. More generally, if x = by, then y is the logarithm of x to base b, written logb x, so log10 1000 = 3. As a single-variable function, the logarithm to base b is the inverse of exponentiation with base b.
The logarithm base 10 is called the decimal or common logarithm and is commonly used in science and engineering. The natural logarithm has the number e ≈ 2.718 as its base; its use is widespread in mathematics and physics because of its very simple derivative. The binary logarithm uses base 2 and is widely used in computer science, information theory, music theory, and photography. When the base is unambiguous from the context or irrelevant it is often omitted, and the logarithm is written log x. (Full article...) -
Zhang Heng (Chinese: 張衡; AD 78–139), formerly romanized Chang Heng, was a Chinese polymathic scientist and statesman who lived during the Eastern Han dynasty. Educated in the capital cities of Luoyang and Chang'an, he achieved success as an astronomer, mathematician, seismologist, hydraulic engineer, inventor, geographer, cartographer, ethnographer, artist, poet, philosopher, politician, and literary scholar.
Zhang Heng began his career as a minor civil servant in Nanyang. Eventually, he became Chief Astronomer, Prefect of the Majors for Official Carriages, and then Palace Attendant at the imperial court. His uncompromising stance on historical and calendrical issues led to his becoming a controversial figure, preventing him from rising to the status of Grand Historian. His political rivalry with the palace eunuchs during the reign of Emperor Shun (r. 125–144) led to his decision to retire from the central court to serve as an administrator of Hejian Kingdom in present-day Hebei. Zhang returned home to Nanyang for a short time, before being recalled to serve in the capital once more in 138. He died there a year later, in 139. (Full article...) -

High-precision test of general relativity by the Cassini space probe (artist's impression): radio signals sent between the Earth and the probe (green wave) are delayed by the warping of spacetime (blue lines) due to the Sun's mass.
General relativity is a theory of gravitation developed by Albert Einstein between 1907 and 1915. The theory of general relativity says that the observed gravitational effect between masses results from their warping of spacetime.
By the beginning of the 20th century, Newton's law of universal gravitation had been accepted for more than two hundred years as a valid description of the gravitational force between masses. In Newton's model, gravity is the result of an attractive force between massive objects. Although even Newton was troubled by the unknown nature of that force, the basic framework was extremely successful at describing motion. (Full article...) -
Algebra is the branch of mathematics that studies certain abstract systems, known as algebraic structures, and the manipulation of expressions within those systems. It is a generalization of arithmetic that introduces variables and algebraic operations other than the standard arithmetic operations, such as addition and multiplication.
Elementary algebra is the main form of algebra taught in schools. It examines mathematical statements using variables for unspecified values and seeks to determine for which values the statements are true. To do so, it uses different methods of transforming equations to isolate variables. Linear algebra is a closely related field that investigates linear equations and combinations of them called systems of linear equations. It provides methods to find the values that solve all equations in the system at the same time, and to study the set of these solutions. (Full article...) -
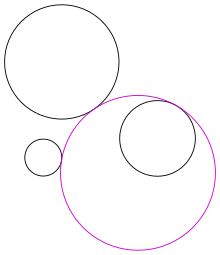
Figure 1: A solution (in purple) to Apollonius's problem. The given circles are shown in black.
In Euclidean plane geometry, Apollonius's problem is to construct circles that are tangent to three given circles in a plane (Figure 1). Apollonius of Perga (c. 262 BC – c. 190 BC) posed and solved this famous problem in his work Ἐπαφαί (Epaphaí, "Tangencies"); this work has been lost, but a 4th-century AD report of his results by Pappus of Alexandria has survived. Three given circles generically have eight different circles that are tangent to them (Figure 2), a pair of solutions for each way to divide the three given circles in two subsets (there are 4 ways to divide a set of cardinality 3 in 2 parts).
In the 16th century, Adriaan van Roomen solved the problem using intersecting hyperbolas, but this solution does not use only straightedge and compass constructions. François Viète found such a solution by exploiting limiting cases: any of the three given circles can be shrunk to zero radius (a point) or expanded to infinite radius (a line). Viète's approach, which uses simpler limiting cases to solve more complicated ones, is considered a plausible reconstruction of Apollonius' method. The method of van Roomen was simplified by Isaac Newton, who showed that Apollonius' problem is equivalent to finding a position from the differences of its distances to three known points. This has applications in navigation and positioning systems such as LORAN. (Full article...) -
Shen Kuo (Chinese: 沈括; 1031–1095) or Shen Gua, courtesy name Cunzhong (存中) and pseudonym Mengqi (now usually given as Mengxi) Weng (夢溪翁), was a Chinese polymath, scientist, and statesman of the Song dynasty (960–1279). Shen was a master in many fields of study including mathematics, optics, and horology. In his career as a civil servant, he became a finance minister, governmental state inspector, head official for the Bureau of Astronomy in the Song court, Assistant Minister of Imperial Hospitality, and also served as an academic chancellor. At court his political allegiance was to the Reformist faction known as the New Policies Group, headed by Chancellor Wang Anshi (1021–1085).
In his Dream Pool Essays or Dream Torrent Essays (夢溪筆談; Mengxi Bitan) of 1088, Shen was the first to describe the magnetic needle compass, which would be used for navigation (first described in Europe by Alexander Neckam in 1187). Shen discovered the concept of true north in terms of magnetic declination towards the north pole, with experimentation of suspended magnetic needles and "the improved meridian determined by Shen's [astronomical] measurement of the distance between the pole star and true north". This was the decisive step in human history to make compasses more useful for navigation, and may have been a concept unknown in Europe for another four hundred years (evidence of German sundials made circa 1450 show markings similar to Chinese geomancers' compasses in regard to declination). (Full article...) -
An actuary is a professional with advanced mathematical skills who deals with the measurement and management of risk and uncertainty. These risks can affect both sides of the balance sheet and require asset management, liability management, and valuation skills. Actuaries provide assessments of financial security systems, with a focus on their complexity, their mathematics, and their mechanisms. The name of the corresponding academic discipline is actuarial science.
While the concept of insurance dates to antiquity, the concepts needed to scientifically measure and mitigate risks have their origins in the 17th century studies of probability and annuities. Actuaries of the 21st century require analytical skills, business knowledge, and an understanding of human behavior and information systems to design programs that manage risk, by determining if the implementation of strategies proposed for mitigating potential risks, does not exceed the expected cost of those risks actualized. The steps needed to become an actuary, including education and licensing, are specific to a given country, with various additional requirements applied by regional administrative units; however, almost all processes impart universal principles of risk assessment, statistical analysis, and risk mitigation, involving rigorously structured training and examination schedules, taking many years to complete. (Full article...) -
General relativity, also known as the general theory of relativity, and as Einstein's theory of gravity, is the geometric theory of gravitation published by Albert Einstein in 1915 and is the current description of gravitation in modern physics. General relativity generalizes special relativity and refines Newton's law of universal gravitation, providing a unified description of gravity as a geometric property of space and time, or four-dimensional spacetime. In particular, the curvature of spacetime is directly related to the energy and momentum of whatever is
present matter and radiation. The relation is specified by the Einstein field equations, a system of second-order partial differential equations.
Newton's law of universal gravitation, which describes classical gravity, can be seen as a prediction of general relativity for the almost flat spacetime geometry around stationary mass distributions. Some predictions of general relativity, however, are beyond Newton's law of universal gravitation in classical physics. These predictions concern the passage of time, the geometry of space, the motion of bodies in free fall, and the propagation of light, and include gravitational time dilation, gravitational lensing, the gravitational redshift of light, the Shapiro time delay and singularities/black holes. So far, all tests of general relativity have been shown to be in agreement with the theory. The time-dependent solutions of general relativity enable us to talk about the history of the universe and have provided the modern framework for cosmology, thus leading to the discovery of the Big Bang and cosmic microwave background radiation. Despite the introduction of a number of alternative theories, general relativity continues to be the simplest theory consistent with experimental data. (Full article...) -
Edward Wright (baptised 8 October 1561; died November 1615) was an English mathematician and cartographer noted for his book Certaine Errors in Navigation (1599; 2nd ed., 1610), which for the first time explained the mathematical basis of the Mercator projection by building on the works of Pedro Nunes, and set out a reference table giving the linear scale multiplication factor as a function of latitude, calculated for each minute of arc up to a latitude of 75°. This was in fact a table of values of the integral of the secant function, and was the essential step needed to make practical both the making and the navigational use of Mercator charts.
Wright was born at Garveston in Norfolk and educated at Gonville and Caius College, Cambridge, where he became a fellow from 1587 to 1596. In 1589 the college granted him leave after Elizabeth I requested that he carry out navigational studies with a raiding expedition organised by the Earl of Cumberland to the Azores to capture Spanish galleons. The expedition's route was the subject of the first map to be prepared according to Wright's projection, which was published in Certaine Errors in 1599. The same year, Wright created and published the first world map produced in England and the first to use the Mercator projection since Gerardus Mercator's original 1569 map. (Full article...) -

Richard Phillips Feynman (/ˈfaɪnmən/; May 11, 1918 – February 15, 1988) was an American theoretical physicist. He is best known for his work in the path integral formulation of quantum mechanics, the theory of quantum electrodynamics, the physics of the superfluidity of supercooled liquid helium, and in particle physics, for which he proposed the parton model. For his contributions to the development of quantum electrodynamics, Feynman received the Nobel Prize in Physics in 1965 jointly with Julian Schwinger and Shin'ichirō Tomonaga.
Feynman developed a widely used pictorial representation scheme for the mathematical expressions describing the behavior of subatomic particles, which later became known as Feynman diagrams. During his lifetime, Feynman became one of the best-known scientists in the world. In a 1999 poll of 130 leading physicists worldwide by the British journal Physics World, he was ranked the seventh-greatest physicist of all time. (Full article...) -

Josiah Willard Gibbs (/ɡɪbz/; February 11, 1839 – April 28, 1903) was an American scientist who made significant theoretical contributions to physics, chemistry, and mathematics. His work on the applications of thermodynamics was instrumental in transforming physical chemistry into a rigorous deductive science. Together with James Clerk Maxwell and Ludwig Boltzmann, he created statistical mechanics (a term that he coined), explaining the laws of thermodynamics as consequences of the statistical properties of ensembles of the possible states of a physical system composed of many particles. Gibbs also worked on the application of Maxwell's equations to problems in physical optics. As a mathematician, he created modern vector calculus (independently of the British scientist Oliver Heaviside, who carried out similar work during the same period) and described the Gibbs phenomenon in the theory of Fourier analysis.
In 1863, Yale University awarded Gibbs the first American doctorate in engineering. After a three-year sojourn in Europe, Gibbs spent the rest of his career at Yale, where he was a professor of mathematical physics from 1871 until his death in 1903. Working in relative isolation, he became the earliest theoretical scientist in the United States to earn an international reputation and was praised by Albert Einstein as "the greatest mind in American history". In 1901, Gibbs received what was then considered the highest honor awarded by the international scientific community, the Copley Medal of the Royal Society of London, "for his contributions to mathematical physics". (Full article...) -
In classical mechanics, the Laplace–Runge–Lenz vector (LRL vector) is a vector used chiefly to describe the shape and orientation of the orbit of one astronomical body around another, such as a binary star or a planet revolving around a star. For two bodies interacting by Newtonian gravity, the LRL vector is a constant of motion, meaning that it is the same no matter where it is calculated on the orbit; equivalently, the LRL vector is said to be conserved. More generally, the LRL vector is conserved in all problems in which two bodies interact by a central force that varies as the inverse square of the distance between them; such problems are called Kepler problems.
The hydrogen atom is a Kepler problem, since it comprises two charged particles interacting by Coulomb's law of electrostatics, another inverse-square central force. The LRL vector was essential in the first quantum mechanical derivation of the spectrum of the hydrogen atom, before the development of the Schrödinger equation. However, this approach is rarely used today. (Full article...)


.jpg)


Good articles
-
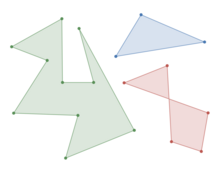
Two simple polygons (green and blue) and a self-intersecting polygon (red, in the lower right, not simple)
In geometry, a simple polygon is a polygon that does not intersect itself and has no holes. That is, it is a piecewise-linear Jordan curve consisting of finitely many line segments. These polygons include as special cases the convex polygons, star-shaped polygons, and monotone polygons.
The sum of external angles of a simple polygon is . Every simple polygon with sides can be triangulated by of its diagonals, and by the art gallery theorem its interior is visible from some of its vertices. (Full article...) -

The integer number line, a set of infinitely many points with integer distances. According to the Erdős–Anning theorem, any such set lies on a line.
The Erdős–Anning theorem states that, whenever an infinite number of points in the plane all have integer distances, the points lie on a straight line. The same result holds in higher dimensional Euclidean spaces.
The theorem cannot be strengthened to give a finite bound on the number of points: there exist arbitrarily large finite sets of points that are not on a line and have integer distances.
The theorem is named after Paul Erdős and Norman H. Anning, who published a proof of it in 1945. Erdős later supplied a simpler proof, which can also be used to check whether a point set forms an Erdős–Diophantine graph, an inextensible system of integer points with integer distances. The Erdős–Anning theorem inspired the Erdős–Ulam problem on the existence of dense point sets with rational distances. (Full article...) -

The regular heptagon cannot be constructed using only a straightedge and compass construction; this can be proven using the field of constructible numbers.
In mathematics, a field is a set on which addition, subtraction, multiplication, and division are defined and behave as the corresponding operations on rational and real numbers. A field is thus a fundamental algebraic structure which is widely used in algebra, number theory, and many other areas of mathematics.
The best known fields are the field of rational numbers, the field of real numbers and the field of complex numbers. Many other fields, such as fields of rational functions, algebraic function fields, algebraic number fields, and p-adic fields are commonly used and studied in mathematics, particularly in number theory and algebraic geometry. Most cryptographic protocols rely on finite fields, i.e., fields with finitely many elements. (Full article...) -
Hugo Dyonizy Steinhaus (English: /ˈhjuːɡoʊ ˈstaɪnhaʊs/ HEW-goh STYNE-howss, Polish: [ˈxuɡɔ ˈʂtajnxaws], German: [ˈhuːɡoː ˈʃtaɪnhaʊs]; 14 January 1887 – 25 February 1972) was a Polish mathematician and educator. Steinhaus obtained his PhD under David Hilbert at Göttingen University in 1911 and later became a professor at the Jan Kazimierz University in Lwów (now Lviv, Ukraine), where he helped establish what later became known as the Lwów School of Mathematics. He is credited with "discovering" mathematician Stefan Banach, with whom he gave a notable contribution to functional analysis through the Banach–Steinhaus theorem. After World War II Steinhaus played an important part in the establishment of the mathematics department at Wrocław University and in the revival of Polish mathematics from the destruction of the war.
Author of around 170 scientific articles and books, Steinhaus has left his legacy and contribution in many branches of mathematics, such as functional analysis, geometry, mathematical logic, and trigonometry. Notably he is regarded as one of the early founders of game theory and probability theory, which led to later development of more comprehensive approaches by other scholars. (Full article...) -

The graph of the 3-3 duoprism (the line graph of ) is perfect. Here it is colored with three colors, with one of its 3-vertex maximum cliques highlighted.
In graph theory, a perfect graph is a graph in which the chromatic number equals the size of the maximum clique, both in the graph itself and in every induced subgraph. In all graphs, the chromatic number is greater than or equal to the size of the maximum clique, but they can be far apart. A graph is perfect when these numbers are equal, and remain equal after the deletion of arbitrary subsets of vertices.
The perfect graphs include many important families of graphs and serve to unify results relating colorings and cliques in those families. For instance, in all perfect graphs, the graph coloring problem, maximum clique problem, and maximum independent set problem can all be solved in polynomial time, despite their greater complexity for non-perfect graphs. In addition, several important minimax theorems in combinatorics, including Dilworth's theorem and Mirsky's theorem on partially ordered sets, Kőnig's theorem on matchings, and the Erdős–Szekeres theorem on monotonic sequences, can be expressed in terms of the perfection of certain associated graphs. (Full article...) -

Partition of a directed graph into a minimum feedback arc set (red dashed edges) and a maximum acyclic subgraph (blue solid edges)
In graph theory and graph algorithms, a feedback arc set or feedback edge set in a directed graph is a subset of the edges of the graph that contains at least one edge out of every cycle in the graph. Removing these edges from the graph breaks all of the cycles, producing an acyclic subgraph of the given graph, often called a directed acyclic graph. A feedback arc set with the fewest possible edges is a minimum feedback arc set and its removal leaves a maximum acyclic subgraph; weighted versions of these optimization problems are also used. If a feedback arc set is minimal, meaning that removing any edge from it produces a subset that is not a feedback arc set, then it has an additional property: reversing all of its edges, rather than removing them, produces a directed acyclic graph.
Feedback arc sets have applications in circuit analysis, chemical engineering, deadlock resolution, ranked voting, ranking competitors in sporting events, mathematical psychology, ethology, and graph drawing. Finding minimum feedback arc sets and maximum acyclic subgraphs is NP-hard; it can be solved exactly in exponential time, or in fixed-parameter tractable time. In polynomial time, the minimum feedback arc set can be approximated to within a polylogarithmic approximation ratio, and maximum acyclic subgraphs can be approximated to within a constant factor. Both are hard to approximate closer than some constant factor, an inapproximability result that can be strengthened under the unique games conjecture. For tournament graphs, the minimum feedback arc set can be approximated more accurately, and for planar graphs both problems can be solved exactly in polynomial time. (Full article...) -

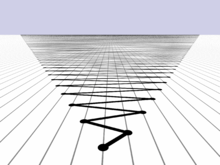
The Laves graph
In geometry and crystallography, the Laves graph is an infinite and highly symmetric system of points and line segments in three-dimensional Euclidean space, forming a periodic graph. Three equal-length segments meet at 120° angles at each point, and all cycles use ten or more segments. It is the shortest possible triply periodic graph, relative to the volume of its fundamental domain. One arrangement of the Laves graph uses one out of every eight of the points in the integer lattice as its points, and connects all pairs of these points that are nearest neighbors, at distance . It can also be defined, divorced from its geometry, as an abstract undirected graph, a covering graph of the complete graph on four vertices.
H. S. M. Coxeter (1955) named this graph after Fritz Laves, who first wrote about it as a crystal structure in 1932. It has also been called the K4 crystal, (10,3)-a network, diamond twin, triamond, and the srs net. The regions of space nearest each vertex of the graph are congruent 17-sided polyhedra that tile space. Its edges lie on diagonals of the regular skew polyhedron, a surface with six squares meeting at each integer point of space. (Full article...) -

17 indivisible camels
The 17-animal inheritance puzzle is a mathematical puzzle involving unequal but fair allocation of indivisible goods, usually stated in terms of inheritance of a number of large animals (17 camels, 17 horses, 17 elephants, etc.) which must be divided in some stated proportion among a number of beneficiaries. It is a common example of an apportionment problem.
Despite often being framed as a puzzle, it is more an anecdote about a curious calculation than a problem with a clear mathematical solution. Beyond recreational mathematics and mathematics education, the story has been repeated as a parable with varied metaphorical meanings. (Full article...) -

Measuring the width of a Reuleaux triangle as the distance between parallel supporting lines. Because this distance does not depend on the direction of the lines, the Reuleaux triangle is a curve of constant width.
In geometry, a curve of constant width is a simple closed curve in the plane whose width (the distance between parallel supporting lines) is the same in all directions. The shape bounded by a curve of constant width is a body of constant width or an orbiform, the name given to these shapes by Leonhard Euler. Standard examples are the circle and the Reuleaux triangle. These curves can also be constructed using circular arcs centered at crossings of an arrangement of lines, as the involutes of certain curves, or by intersecting circles centered on a partial curve.
Every body of constant width is a convex set, its boundary crossed at most twice by any line, and if the line crosses perpendicularly it does so at both crossings, separated by the width. By Barbier's theorem, the body's perimeter is exactly π times its width, but its area depends on its shape, with the Reuleaux triangle having the smallest possible area for its width and the circle the largest. Every superset of a body of constant width includes pairs of points that are farther apart than the width, and every curve of constant width includes at least six points of extreme curvature. Although the Reuleaux triangle is not smooth, curves of constant width can always be approximated arbitrarily closely by smooth curves of the same constant width. (Full article...) -
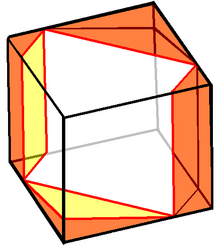
A unit cube with a hole cut through it, large enough to allow Prince Rupert's cube to pass
In geometry, Prince Rupert's cube is the largest cube that can pass through a hole cut through a unit cube without splitting it into separate pieces. Its side length is approximately 1.06, 6% larger than the side length 1 of the unit cube through which it passes. The problem of finding the largest square that lies entirely within a unit cube is closely related, and has the same solution.
Prince Rupert's cube is named after Prince Rupert of the Rhine, who asked whether a cube could be passed through a hole made in another cube of the same size without splitting the cube into two pieces. A positive answer was given by John Wallis. Approximately 100 years later, Pieter Nieuwland found the largest possible cube that can pass through a hole in a unit cube. (Full article...) -

Two random distributions on three-vertex binary trees, the binary search trees on three keys a, b, and c. These five trees are each assigned probability 1/5 by the uniform distribution (top). The distribution generated by random insertion orderings (bottom) assigns the center tree probability 1/3, because two of the six possible insertion orderings generate the same tree; the other four trees have probability 1/6.
In computer science and probability theory, a random binary tree is a binary tree selected at random from some probability distribution on binary trees. Different distributions have been used, leading to different properties for these trees.
Random binary trees have been used for analyzing the average-case complexity of data structures based on binary search trees. For this application it is common to use random trees formed by inserting nodes one at a time according to a random permutation. The resulting trees are very likely to have logarithmic depth and logarithmic Strahler number. The treap and related balanced binary search trees use update operations that maintain this random structure even when the update sequence is non-random. (Full article...) -
In graph theory, a cop-win graph is an undirected graph on which the pursuer (cop) can always win a pursuit–evasion game against a robber, with the players taking alternating turns in which they can choose to move along an edge of a graph or stay put, until the cop lands on the robber's vertex. Finite cop-win graphs are also called dismantlable graphs or constructible graphs, because they can be dismantled by repeatedly removing a dominated vertex (one whose closed neighborhood is a subset of another vertex's neighborhood) or constructed by repeatedly adding such a vertex. The cop-win graphs can be recognized in polynomial time by a greedy algorithm that constructs a dismantling order. They include the chordal graphs, and the graphs that contain a universal vertex. (Full article...)


Did you know
- ... that circle packings in the form of a Doyle spiral were used to model plant growth long before their mathematical investigation by Doyle?
- ... that owner Matthew Benham influenced both Brentford FC in the UK and FC Midtjylland in Denmark to use mathematical modelling to recruit undervalued football players?
- ... that multiple mathematics competitions have made use of Sophie Germain's identity?
- ... that Fairleigh Dickinson's upset victory over Purdue was the biggest upset in terms of point spread in NCAA tournament history, with Purdue being a 23+1⁄2-point favorite?
- ... that Latvian-Soviet artist Karlis Johansons exhibited a skeletal tensegrity form of the Schönhardt polyhedron seven years before Erich Schönhardt's 1928 paper on its mathematics?
- ... that Catechumen, a Christian first-person shooter, was funded only in the aftermath of the Columbine High School massacre?
- ... that ten-sided gaming dice have kite-shaped faces?
- ... that the music of math rock band Jyocho has been alternatively described as akin to "madness" or "contemplative and melancholy"?

- ... that there are 115,200 solutions to the ménage problem of permuting six female-male couples at a twelve-person table so that men and women alternate and are seated away from their partners?
- ... that mathematician Paul Erdős called the Hadwiger conjecture, a still-open generalization of the four-color problem, "one of the deepest unsolved problems in graph theory"?
- ...that the six permutations of the vector (1,2,3) form a regular hexagon in 3d space, the 24 permutations of (1,2,3,4) form a truncated octahedron in four dimensions, and both are examples of permutohedra?
- ...that Ostomachion is a mathematical treatise attributed to Archimedes on a 14-piece tiling puzzle similar to tangram?
- ...that some functions can be written as an infinite sum of trigonometric polynomials and that this sum is called the Fourier series of that function?
- ...that the identity elements for arithmetic operations make use of the only two whole numbers that are neither composites nor prime numbers, 0 and 1?
- ...that as of April 2010 only 35 even numbers have been found that are not the sum of two primes which are each in a Twin Primes pair? ref
Featured pictures
-

-
 Fields Medal, back, by Stefan Zachow (edited by King of Hearts) (from Wikipedia:Featured pictures/Sciences/Mathematics)
 -
 Desargues' theorem, by Dynablast (edited by Jujutacular and Julia W) (from Wikipedia:Featured pictures/Sciences/Mathematics)
 -

-
 Cellular automata at Reflector (cellular automaton), by Simpsons contributor (from Wikipedia:Featured pictures/Sciences/Mathematics)
 -
 Hypotrochoid, by Sam Derbyshire (edited by Anevrisme and Perhelion) (from Wikipedia:Featured pictures/Sciences/Mathematics)
 -

-

-

-

-

-

-

-

-
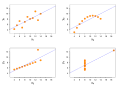 Anscombe's quartet, by Schutz (edited by Avenue) (from Wikipedia:Featured pictures/Sciences/Mathematics)
 -

-

-
 Proof of the Pythagorean theorem, by Joaquim Alves Gaspar (from Wikipedia:Featured pictures/Sciences/Mathematics)
 -

-
 Tetrahedral group at Symmetry group, by Debivort (from Wikipedia:Featured pictures/Sciences/Mathematics)
 -
 Lorenz attractor at Chaos theory, by Wikimol (from Wikipedia:Featured pictures/Sciences/Mathematics)
 -
-

-

-
 Line integral of scalar field, by Lucas V. Barbosa (from Wikipedia:Featured pictures/Sciences/Mathematics)
 -

-
-
 Fields Medal, front, by Stefan Zachow (edited by King of Hearts) (from Wikipedia:Featured pictures/Sciences/Mathematics)
 -

-

-

-

-

-


Get involved
- For editor resources and to collaborate with other editors on improving Wikipedia's Mathematics-related articles, visit WikiProject Mathematics.
Categories
Topics
Index of articles
| ARTICLE INDEX: | |
| MATHEMATICIANS: |
Vital articles
- » subpages: Level 4 Mathematics articles, Level 5 Mathematics articles
Discover Wikipedia using portals


Previous Page Next Page

