Our website is made possible by displaying online advertisements to our visitors.
Please consider supporting us by disabling your ad blocker.
Curve fitting

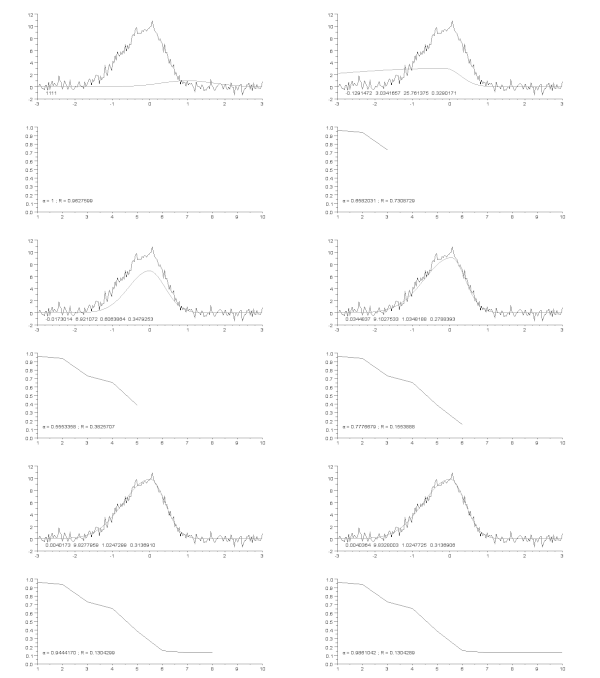
Top: raw data and model.
Bottom: evolution of the normalised sum of the squares of the errors.
Curve fitting is constructing a mathematical function which best fits a set of data points.[1][2][3]
Curve fitting may involve either interpolation[4] or smoothing.[5] Using interpolation requires an exact fit to the data. With smoothing, a "smooth" function is constructed, that fit the data approximately. A related topic is regression analysis,[6][7] which focuses more on questions of statistical inference such as how much uncertainty is present in a curve that is fit to data observed with random errors.
Fitted curves can be used to help data visualization,[8][9] to guess values of a function where no data is available,[10] and to summarize the relationships among two or more variables.[11] Extrapolation refers to the use of a fitted curve beyond the range of the observed data.[12] This is subject to a degree of uncertainty,[13] since it may reflect the method used to construct the curve as much as it reflects the observed data.
- ↑ S.S. Halli, K.V. Rao. 1992. Advanced Techniques of Population Analysis. ISBN 0306439972 Page 165 (cf. ... functions are fulfilled if we have a good to moderate fit for the observed data.)
- ↑ The Signal and the Noise: why so many predictions fail - but some don't. Nate Silver
- ↑ Data Preparation for Data Mining: Text. Dorian Pyle.
- ↑ Numerical Methods in Engineering with Python 3. Jaan Kiusalaas. p21, 24.
- ↑ Numerical methods of curve fitting. Philip George Guest. Page 349.
- ↑ Fitting Models to Biological Data Using Linear and Nonlinear Regression. Harvey Motulsky, Arthur Christopoulos.
- ↑ Regression analysis. Rudolf J. Freund, William J. Wilson, Ping Sa. p 269.
- ↑ Visual Informatics. Halimah Badioze Zaman et al. Page 689.
- ↑ Numerical Methods for Nonlinear Engineering Models. By John R. Hauser. Page 227.
- ↑ Methods of Experimental Physics: Spectroscopy, vol 13, Part 1. Claire Marton. p 150.
- ↑ Encyclopedia of research design, vol 1. Edited by Neil J. Salkind. p 266.
- ↑ Community analysis and planning techniques. Richard E. Klosterman. p 1.
- ↑ An introduction to risk and uncertainty in the evaluation of environmental investments. DIANE Publishing. pg 69
Previous Page Next Page


