Back خط منسوب Arabic Isollinia AST İzoxətt AZ Изолиния BA Ізалінія BE Ізалінія BE-X-OLD Изолиния Bulgarian সমোন্নতি রেখা Bengali/Bangla Isolínia Catalan Izolinie Czech


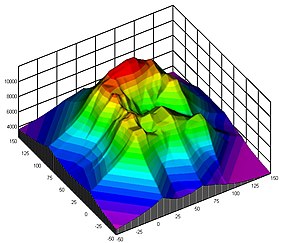
A contour line (also isoline, isopleth, isoquant or isarithm) of a function of two variables is a curve along which the function has a constant value, so that the curve joins points of equal value.[1][2] It is a plane section of the three-dimensional graph of the function parallel to the -plane. More generally, a contour line for a function of two variables is a curve connecting points where the function has the same particular value.[2]
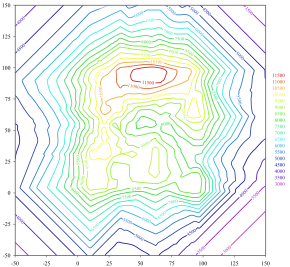
In cartography, a contour line (often just called a "contour") joins points of equal elevation (height) above a given level, such as mean sea level.[3] A contour map is a map illustrated with contour lines, for example a topographic map, which thus shows valleys and hills, and the steepness or gentleness of slopes.[4] The contour interval of a contour map is the difference in elevation between successive contour lines.[5]
The gradient of the function is always perpendicular to the contour lines. When the lines are close together the magnitude of the gradient is large: the variation is steep. A level set is a generalization of a contour line for functions of any number of variables.
Contour lines are curved, straight or a mixture of both lines on a map describing the intersection of a real or hypothetical surface with one or more horizontal planes. The configuration of these contours allows map readers to infer the relative gradient of a parameter and estimate that parameter at specific places. Contour lines may be either traced on a visible three-dimensional model of the surface, as when a photogrammetrist viewing a stereo-model plots elevation contours, or interpolated from the estimated surface elevations, as when a computer program threads contours through a network of observation points of area centroids. In the latter case, the method of interpolation affects the reliability of individual isolines and their portrayal of slope, pits and peaks.[6]
- ^ Courant, Richard, Herbert Robbins, and Ian Stewart. What Is Mathematics?: An Elementary Approach to Ideas and Methods. New York: Oxford University Press, 1996. p. 344.
- ^ a b Hughes-Hallett, Deborah; McCallum, William G.; Gleason, Andrew M. (2013). Calculus : Single and Multivariable (6 ed.). John wiley. ISBN 978-0470-88861-2.
- ^ "Definition of contour line". Dictionary.com. Retrieved 2022-04-04.
- ^ "Definition of CONTOUR MAP". Merriam-Webster. Retrieved 2022-04-04.
- ^ Tracy, John C. Plane Surveying; A Text-Book and Pocket Manual. New York: J. Wiley & Sons, 1907. p. 337.
- ^ Davis, John C., 1986, Statistics and data analysis in geology, Wiley ISBN 0-471-08079-9

