Back Normalverteilung ALS توزيع احتمالي طبيعي Arabic Distribución normal AST Normal paylanma AZ نورمال داغیلیم AZB Нармальнае размеркаванне BE Нормално разпределение Bulgarian Normalna raspodjela BS Distribució normal Catalan Normální rozdělení Czech
|
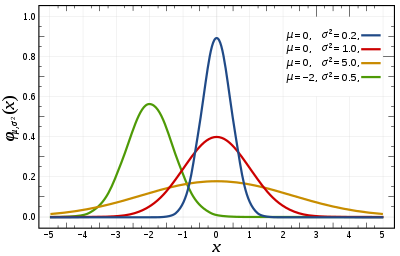
Probability density function  The red curve is the standard normal distribution. | |||
|
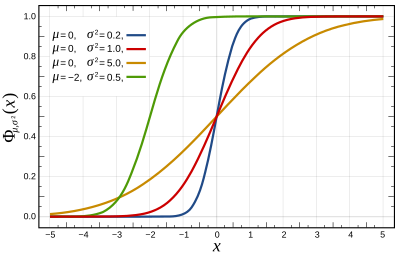
Cumulative distribution function  | |||
| Notation | |||
|---|---|---|---|
| Parameters |
= mean (location) = variance (squared scale) | ||
| Support | |||
| CDF | |||
| Quantile | |||
| Mean | |||
| Median | |||
| Mode | |||
| Variance | |||
| MAD | |||
| Skewness | |||
| Excess kurtosis | |||
| Entropy | |||
| MGF | |||
| CF | |||
| Fisher information |
| ||
| Kullback–Leibler divergence | |||
| Expected shortfall | [1] | ||
| Part of a series on statistics |
| Probability theory |
|---|
 |
In probability theory and statistics, a normal distribution or Gaussian distribution is a type of continuous probability distribution for a real-valued random variable. The general form of its probability density function is The parameter is the mean or expectation of the distribution (and also its median and mode), while the parameter is the variance. The standard deviation of the distribution is (sigma). A random variable with a Gaussian distribution is said to be normally distributed, and is called a normal deviate.
Normal distributions are important in statistics and are often used in the natural and social sciences to represent real-valued random variables whose distributions are not known.[2][3] Their importance is partly due to the central limit theorem. It states that, under some conditions, the average of many samples (observations) of a random variable with finite mean and variance is itself a random variable—whose distribution converges to a normal distribution as the number of samples increases. Therefore, physical quantities that are expected to be the sum of many independent processes, such as measurement errors, often have distributions that are nearly normal.[4]
Moreover, Gaussian distributions have some unique properties that are valuable in analytic studies. For instance, any linear combination of a fixed collection of independent normal deviates is a normal deviate. Many results and methods, such as propagation of uncertainty and least squares[5] parameter fitting, can be derived analytically in explicit form when the relevant variables are normally distributed.
A normal distribution is sometimes informally called a bell curve.[6] However, many other distributions are bell-shaped (such as the Cauchy, Student's t, and logistic distributions). (For other names, see Naming.)
The univariate probability distribution is generalized for vectors in the multivariate normal distribution and for matrices in the matrix normal distribution.
- ^ Norton, Matthew; Khokhlov, Valentyn; Uryasev, Stan (2019). "Calculating CVaR and bPOE for common probability distributions with application to portfolio optimization and density estimation" (PDF). Annals of Operations Research. 299 (1–2). Springer: 1281–1315. arXiv:1811.11301. doi:10.1007/s10479-019-03373-1. S2CID 254231768. Archived from the original (PDF) on March 31, 2023. Retrieved February 27, 2023.
- ^ Normal Distribution, Gale Encyclopedia of Psychology
- ^ Casella & Berger (2001, p. 102)
- ^ Lyon, A. (2014). Why are Normal Distributions Normal?, The British Journal for the Philosophy of Science.
- ^ Jorge, Nocedal; Stephan, J. Wright (2006). Numerical Optimization (2nd ed.). Springer. p. 249. ISBN 978-0387-30303-1.
- ^ "Normal Distribution". www.mathsisfun.com. Retrieved August 15, 2020.


![{\displaystyle \Phi \left({\frac {x-\mu }{\sigma }}\right)={\frac {1}{2}}\left[1+\operatorname {erf} \left({\frac {x-\mu }{\sigma {\sqrt {2}}}}\right)\right]}](https://wikimedia.org/api/rest_v1/media/math/render/svg/c0fed43e25966344745178c406f04b15d0fa3783)


