Back تصوير علمي Arabic Visualización científica Spanish Teaduslik visualiseerimine ET مصورسازی علمی FA Visualisation scientifique French Visualização científica Portuguese Научная визуализация Russian Наукова візуалізація Ukrainian 科学可视化 Chinese 科學視覺化 ZH-YUE


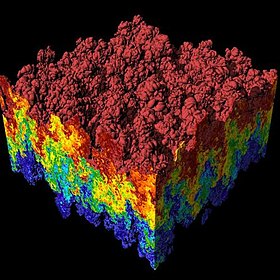
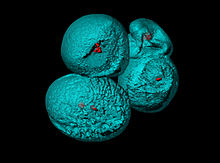
Scientific visualization (also spelled scientific visualisation) is an interdisciplinary branch of science concerned with the visualization of scientific phenomena.[2] It is also considered a subset of computer graphics, a branch of computer science. The purpose of scientific visualization is to graphically illustrate scientific data to enable scientists to understand, illustrate, and glean insight from their data. Research into how people read and misread various types of visualizations is helping to determine what types and features of visualizations are most understandable and effective in conveying information.[3][4]
- ^ Visualizations that have been created with VisIt. at wci.llnl.gov. Updated: November 8, 2007
- ^ Michael Friendly (2008). "Milestones in the history of thematic cartography, statistical graphics, and data visualization".
- ^ Mason, Betsy (November 12, 2019). "Why scientists need to be better at data visualization". Knowable Magazine. doi:10.1146/knowable-110919-1. S2CID 209062044.
{{cite journal}}: CS1 maint: date and year (link) - ^ O'Donoghue, Seán I.; Baldi, Benedetta Frida; Clark, Susan J.; Darling, Aaron E.; Hogan, James M.; Kaur, Sandeep; Maier-Hein, Lena; McCarthy, Davis J.; Moore, William J.; Stenau, Esther; Swedlow, Jason R.; Vuong, Jenny; Procter, James B. (2018-07-20). "Visualization of Biomedical Data". Annual Review of Biomedical Data Science. 1 (1): 275–304. doi:10.1146/annurev-biodatasci-080917-013424. hdl:10453/125943. S2CID 199591321. Retrieved 25 June 2021.